
Privacy Data Dashboard
A scrutinized solution to preserve users’ and bystanders’ privacy concerns in smart homes!
Introduction
Smart homes have been increasingly prevalent in recent years due to their great efficiency and convenience. The IoT devices connected in a smart home are equipped with various sensors which possess the ability to collect a massive amount of data of users and their surrounding environment, which pose privacy risks to the users. Broadly speaking, there are two types of stakeholders involved in a smart home, i.e., users, and bystanders. This case study defines smart home users as those who own smart home devices, and defines smart home bystanders as those who do not own smart home devices but may be subject to the data collection by smart home devices.
General users have very limited ways to learn about these data practices. To explore different privacy notice modalities along with people's preferences for receiving privacy notifications in smart homes I led a scenario based survey study inclusive of four privacy notice mechanisms with an overarching research question; “How to deliver privacy notifications and raise users’ and bystanders’ awareness of data practices in smart homes?”
Among four privacy notice mechanisms presented to the participants; The Privacy Data Dashboard emerged as the most perceived notification mechanism for being an unobtrusive modality to deliver privacy notice, easy to access and offering privacy choices along with privacy controls. The in depth findings from the survey impelled me to apply my learnings as a User Researcher and an Experience Designer to bring the Privacy Data Dashboard into reality in the form of a fully functional product prototype, which could overcome privacy concerns for all.
This UX case study narrates how the Privacy Data Dashboard evolved from a notification mechanism concept to a high fidelity clickable prototype through various research and design phases.
User Survey
Asking right questions is already half the solution!
To understand users' privacy perceptions about smart home technology, we implemented two surveys for the two identified stakeholders involved in a smart home; Users, and Bystanders. One of the main reasons to choose two stakeholders was to be able to present empathetic results from users and bystanders perspectives for privacy in smart homes. The two versions used the same set of questions following the same flow, but some questions were framed slightly differently, keeping in mind differences in participant perceptions.
Survey Design
The survey was inclusive of quantitative questions (Dichotomous, 5-point likert scale and multiple choice questions) as well as qualitative questions (Open End). The survey was structured into three sections. The initial part of the survey consisted of background questions to understand participants, their current understanding, and experiences with smart home devices. Then, participants were introduced and presented with questions for four privacy awareness mechanisms. These privacy mechanisms were inclusive of the privacy dashboard, the privacy speaker, the ambient light, and the mobility app. In the final section participants were presented with four hypothetical scenarios which were aimed towards gaining an understanding of the influence of specific contexts on their privacy perceptions. These scenarios include a Biometric Security scenario, a Friend Visiting scenario, a Work from Home scenario, and a Health Data Tracking scenario.
Background and Demographic Questions
We start the survey by asking participants about their experiences of using smart home devices, including the devices they have used/own, purposes, and location of these devices. We then ask participants to indicate their experiences and preferences of receiving notifications in smart homes in general, including what types of notifications they have received, how they generally receive notifications, and their willingness to receive notifications. We finish this section by asking participants their overall concern level regarding data collection in smart homes using Likert scale questions.
Privacy Awareness Mechanism Based Questions
Then, we introduced four privacy awareness mechanisms to participants. These mechanisms include a Privacy Dashboard, a Mobility App, an Ambient Light, and a Privacy Speaker. Here the participants were asked to rate each mechanism based on their perceived effectiveness, perceived ease to use, and comfort level to use through five-points Likert scale questions.
The choices and design of the four mechanisms are motivated by four considerations. First, existing smart home devices generally send notifications to users in four different ways, i.e., visual signals (e.g., LED indicator), audio cues (e.g., voice reminder), push notification through associated apps, and interactive web apps. Thus, when we design privacy awareness mechanisms, we aim to leverage these modalities in our designs. Second, instead of leveraging the built-in functions in smart home IoT devices, we choose to design standalone devices for delivering privacy-related notifications since the notification features in most off-the-shelf smart home devices are not designed to inform users of data practices. Thus, we take an alternative route and design external awareness mechanisms to offer more possibilities. Lastly, we also consider the technical feasibility of each mechanism to make sure that they are not unrealistically speculative.
Scenario Based Questions

Prior literature suggests that people’s privacy perceptions are deeply rooted in and can be influenced by specific contexts. (Privacy Perceptions and Designs of Bystanders in Smart Homes, " What if?" Predicting Individual Users' Smart Home Privacy Preferences and Their Changes) Hence, we included four hypothetical scenarios in the last part of the survey to help understand. When crafting the scenarios, we deliberately considered several factors, such as types of devices, purposes of device usage, social relationships, etc. We also frame each scenario description from both users’ and bystanders’ perspectives.
Participants

We implemented both survey branches on Qualtrics and recruited survey participants from Prolific, a crowdsourcing platform. Participants would qualify for the user survey if they have owned smart home devices in their own homes. This qualification check was completed by a built-in filter provided on Prolific. We did not have a requirement on bystanders’ prior experiences with smart home devices because anyone can be a bystander in some contexts, regardless of their experiences or ownership of smart devices. For both surveys, eligible participants were required to be located in the US, be over 18 years old and have at least 95% task approval rate on Prolific. In total, we collected 300 responses, with 150 responses from each survey branch. After removing the low-quality responses, we receive 136 valid responses from the user survey and 123 valid responses from the bystander survey.
Qualitative Analysis
Moving back and forward between the entire data!

Our surveys contained both quantitative data (i.e., binary questions, multiple selection questions, and 5-point Likert scale questions) and qualitative questions (i.e., open-ended questions). Upon completion of data collection, three researchers went through all data several times to familiarize themselves with the data, and at the same time, identify low-quality responses. For qualitative responses, we, a team of three researchers conducted a thematic analysis. We first coded a subset of the data together to establish a basic common understanding of the coding and come up with an initial codebook. Then, we independently coded another subset of the dataset. Upon completion, we met, discussed, and reconciled our codes to resolve any disagreements and also updated the codebook. Using this codebook, we divided the rest of the data and finished the coding independently. During the process, we constantly checked each others codes to make sure the coding was done properly.
Results
Data Dashboard - The best perceived mechanism by users and bystanders to receive privacy notice in smart homes!
We merged “agree” and “somewhat agree” responses for each mechanism to represent positive attitudes. And merging “disagree” and “somewhat disagree” to represent a negative attitude of the participants. The Data Dashboard was very well perceived by both users and bystanders regarding its perceived effectiveness (users: 89% positive; bystanders: 79% positive) and perceived ease of use (users: 81% positive; bystanders: 67% positive). However, the comfortableness of adopting the dashboard dropped for both users (57% positive) and bystanders (54% positive). By performing thematic analysis on the open-ended questions, we could identify main benefits and drawbacks for the data dashboard.
Benefits
● Providing detailed information
Both users (n=54) and bystanders (n=46) appreciated the detailed information provided by the Data Dashboard. They believed that a data dashboard could provide all the information they might need to know regarding the data practices of smart home devices (e.g., data collection, data sharing, data volume, types of data, etc.).
User 80 found the Data Dashboard to be very detailed and believed that it would reduce his privacy concerns,
“I think this is probably the best one. It gives many details and I would probably buy and use it. It would help alleviate my concerns a bit.”
● A centralized source of information
Another advantage brought up by both users (n=22) and bystanders (n=17) is the centralization of the information. Participants appraised the device since they would be able to see all the details of the data practices across all smart home devices they have. Given that a relatively large portion of our participants had more than one smart home device, the centralized source of information reduced the amount of effort from our participants to understand the data practices.
User 102 explained this point nicely,
“In theory, this Data Dashboard sounds like an effective way to understand data usage from smart home devices. I think that it would definitely take some time to understand how it works, but having everything in one place seems like an easy way to understand data usage across smart devices.”
Drawbacks
● Lack of control
One major concern shared by both users (n=24) and bystanders (n=23) is the lack of control in the Data Dashboard. They argued that simply providing details of data practices would not help with alleviating their privacy concerns as they could not do anything about it. This concern highlights the fact that privacy awareness alone is not enough in the context of smart homes, as people would also expect to have control of their data.
Bystander 39 illustrated her view on this point, indicating that not having access to stop the recording did not help with mitigating her privacy concerns.
“If I am a bystander and not the owner of this device, I wouldn’t have access to changing the features or anything according to my preferences, which would not alleviate any fears.”
● An additional piece of device
Some users (n=9) expressed the concern that they would need to purchase another device for their home, making it a less appealing option. This is particularly true if the Data Dashboard is only able to provide details of the data practices without enabling any controls to limit the data collection.
User 102 said,
“I like how detailed this device is but I would not want to have another device mounted in my house if all it does is give me feedback about data.”
Results Summary
Here’s why the Privacy Data Dashboard is a probable solution for users and bystanders’ privacy needs!

Overall, we also observed a lot of similarities and differences between users and bystanders. Talking about the similarities first. Both the users and the bystanders preferred detailed information about data practices surrounding smart home devices. Also, all participants preferred privacy awareness mechanisms that provided not only notice, but also some sort of control to make privacy choices. Further, talking about the differences, the one that stood out was that Users tend to prioritize device utility over privacy protection, while bystanders tend to consider social factors such as social relationship and power dynamics while deciding to protect their privacy.
Our findings also indicated a lot of design implications which could improve people’s awareness of the data practices of surrounding smart home devices. All participants preferred notification mechanisms that provided easy and equal access. Existing ways to convey privacy-related information in smart homes (e.g., device privacy policies, data recording history) are mostly designed for users to understand the data practices of their smart home devices. When bystanders are involved in the data collection, there is no easy way for them to learn about the data practices, especially when bystanders do not have prior knowledge or experience of smart home devices.
Second, an unobtrusive modality to deliver privacy notices for users and bystanders who prefer to learn about data practices in the background at the time they occur and being able to access them at their convenience. Our findings suggest that in situations like working from home and friends visiting, people may prefer unobtrusive notifications to avoid any interruption in their current activities. Moving on, existing privacy notices are device-specific only. We found that people are eager to know about data practices as a centralized source from all the devices connected in a smart home. Hence, we imply to have privacy notices at the smart home level. Lastly, providing users with privacy choices along with privacy notices, particularly for people to cater their privacy preferences protects their privacy. All these parameters clearly indicate Data Dashboard to be the most suitable option to be brought into existence, keeping in mind the scope for including all the design implications that emerged from our research.
Storyboarding
Definitely an amazing concept, but is the Privacy Data Dashboard a practical solution?
The main motive with the storyboards was to identify the potential of how compelling the Data Dashboard could result to be for both users and bystanders in the smart home. The challenge here was to come up with a storyline with a combination of personas and scenarios to identify the practical feasibility for the Data Dashboard in smart environments.. The storyboards focused on two main stakeholder personas which are users and bystanders and were inspired by work-from home and friends visiting scenarios. The storyboarding process is started by breaking down the scenarios into multiple scenes and then creating corresponding frames for each of the scenes. This helped me reimagine the scenarios to further bind them into an interactive sequence.

Initially, a lot of scenes were sketched on sticky notes. The scenes were rearranged and reimagined to derive a solid story line. The sequence of the story was determined by placing these sticky notes on a whiteboard. A lot of alternative interaction scenarios were also envisioned in this phase. Finally, all the viability, desirability and feasibility of each frame determined the final structure for the storyboards. These sticky notes were then transformed into a higher fidelity for better presentation.
Storyboard 1

Storyboard 2

What about the user and bystander Power Dynamics in a smart home?
The storyboards were sent to collaborators who worked on the smart home notification research study to gain their perspective for the feasibility and application of the Privacy Data Dashboard. The collaborators indicated the power dynamics in the smart home which was one common aspect which I missed out to consider during creating the storyboard.
The questions concerning power dynamics which arose with Storyboard 2 were:
Q. How will the bystanders know about smart devices and dashboards if the smart home owners, for some reason, fail to inform them?
Q. What if Riri did not see the smart camera in the first place?
Q. What if some people feel awkward reaching out to smart home owners regarding their concerns?
To address these concerns, I tracked back to survey responses from bystanders to understand their precise perceptions underlying the themes underlying power dynamics. 14 bystanders expressed discomfort in using the privacy dashboard in others’ homes. Here are some of the responses:
Bystander 8 “I think that the data dashboard is a tool that would make it easy to understand data usage in a place where I'm a bystander. However I wouldn't like or feel comfortable using it because it isn't my home or device to use.” and “It seems like an effective device but I would feel uncomfortable using this in someone else's home.”
Bystander 128 “This product is not as discreet as the other ones mentioned. I wouldn't feel very comfortable using a device such as this one in someone else's home, especially if I am not very familiar with the person”
Bystander 98 “I think this device would be helpful in monitoring collection of sensitive data, but if I was a bystander in someone else's home, I would feel less comfortable using the device as it must be mounted with the owner's preference. Basically, I wouldn't have a say in the technology even though it would help me monitor my own info.”
Further, to find a solution to this issue, I brainstormed with my colleagues again to figure out a probable solution for this problem when I came across the IOT Inspector. The IOT inspector a mobile application and digital infrastructure that enables users to discover IoT devices is learn about the data they collect and any controls they might give, such as opting in or out of their data collection and use practices. Combining this technology innovation with the Privacy Data Dashboard was identified to be the most convening and practical solution for implementing the Privacy Data Dashboard. Considering all these factors, I created another storyboard which addressed the concern of power dynamics in a smart home setting.
Storyboard 3

Competitive Analysis
Privacy Data Dashboard fills in the market gap!
Competitive Analysis was performed before the design phase to gain an understanding of the trends and industry standards. During my research I found the Privacy Data Dashboard to be one of a kind product in the industry with no direct competitors. However, the smart displays category possessed most resemblance. Smart displays are also the most probable devices which can adapt to the privacy-preserving practices of the Privacy Data Dashboard. Keeping in mind these factors, I performed competitive analysis with four flagship smart displays from industry leaders.

The results for this competitive analysis are presented from a privacy point of view. A similar trend is observed in privacy controls from the hardware perspective where all smart displays have button/s for catering data collection preferences. However, there is a clear gap in the market which points towards lack of privacy controls from the software perspective. Not a single smart display allows its users to adjust privacy choices for any of the devices connected to a smart home. This further works as evidence for the Privacy Data Dashboard’s capability of filling the gap in the market!
Prototyping the Privacy Data Dashboard with fundamentals of Data Visualization!
The Privacy Data Dashboard gives an opportunity to represent a wide range of data with various factors and attributes. The data could be represented in a number of ways. But the most important challenge was to make the right choices in terms of the chart selection and the design layout. I decided to go back to data visualization basics by referring to Data Visualization: A Handbook for Data Driven Design. I aligned design implications for privacy notice with influential factors and sketched a number of wireframes.
The influential factors considered to build the foundation of the Privacy Data Dashboard Design were:
1. Audience
In this project the audience relates to the users and bystanders who are the collective group of viewers towards whom the visualizations are intended. To satisfy the user needs and determine what to show the audience, understanding the audience's needs was the top priority. I created a question board with visual illustration and mapped all the possible questions which would come to the users and bystanders' minds. Studying literature on the space of privacy in smart homes helped me understand the need for privacy notifications in smart homes and further derive onto the right questions.

2. Data Type
The type of data and range values which were determined to be displayed have the bearing on which charts to use and which will best portray privacy preferences for users and bystanders. Having a set of empirical concerns for privacy in smart homes the next step was to understand the smart devices and their data practices. This was crucial for me to determine the type of information to be included in the Data Dashboard. Studying the smart home devices and their behaviors resulted in a better understanding to present users and bystanders with effective privacy notifications. With the help of resources present on IoTPrivacy portal I came up with this illustration of the cloud which helps in understanding the difference which can be collected by smart devices present in a smart home environment.

3. Purpose
To place an emphasis on the general sense-making for the visualized elements is a crucial factor while representing data. To enable users of the Privacy Data Dashboard with relationships qualities within the data and devices was determined the sole purpose. The basic fundamental of Dashboard design validates the approach of ‘getting a gist’ of data values. Using charts which use attributes of size through variation in data was determined as a fundamental approach for precise perceiving.
4. Composition
Management of space is the key consideration while creating dashboards. Arranging a mixture of visual ingredients from the privacy perspective to form a whole was determined as a crucial influential factors in arranging visual elements on the dashboard. An iterative approach for all screens was performed with help of pencil sketches to determine the layout which satisfied the hierarchy and readability within the dashboard.
5. Technology
What charts can be created and how easily they can be created is a big factor. I consulted the Chartmaker Directory to determine the feasibility for each chart type and accordingly determine the ones to implement.
Sketching Wireframes
Bouncing on and off ideas!
Sketching wireframes was an attempt to set the design direction for the Privacy Data Dashboard by ideating structural elements like layout, information architecture, chart types, and privacy controls. The vision was to have a simple interface which provides users effective notifications and insights about data privacy in smart homes without having deep technical knowledge. Getting thoughts out on paper with quick sketches allowed me to explore a variety of combinations to visually explore various combinations for structural elements for the Privacy Data Dashboard.
Low Fidelity Prototype
Translating sketches into pixels!
Home

Devices

Reports

Settings

Notifications

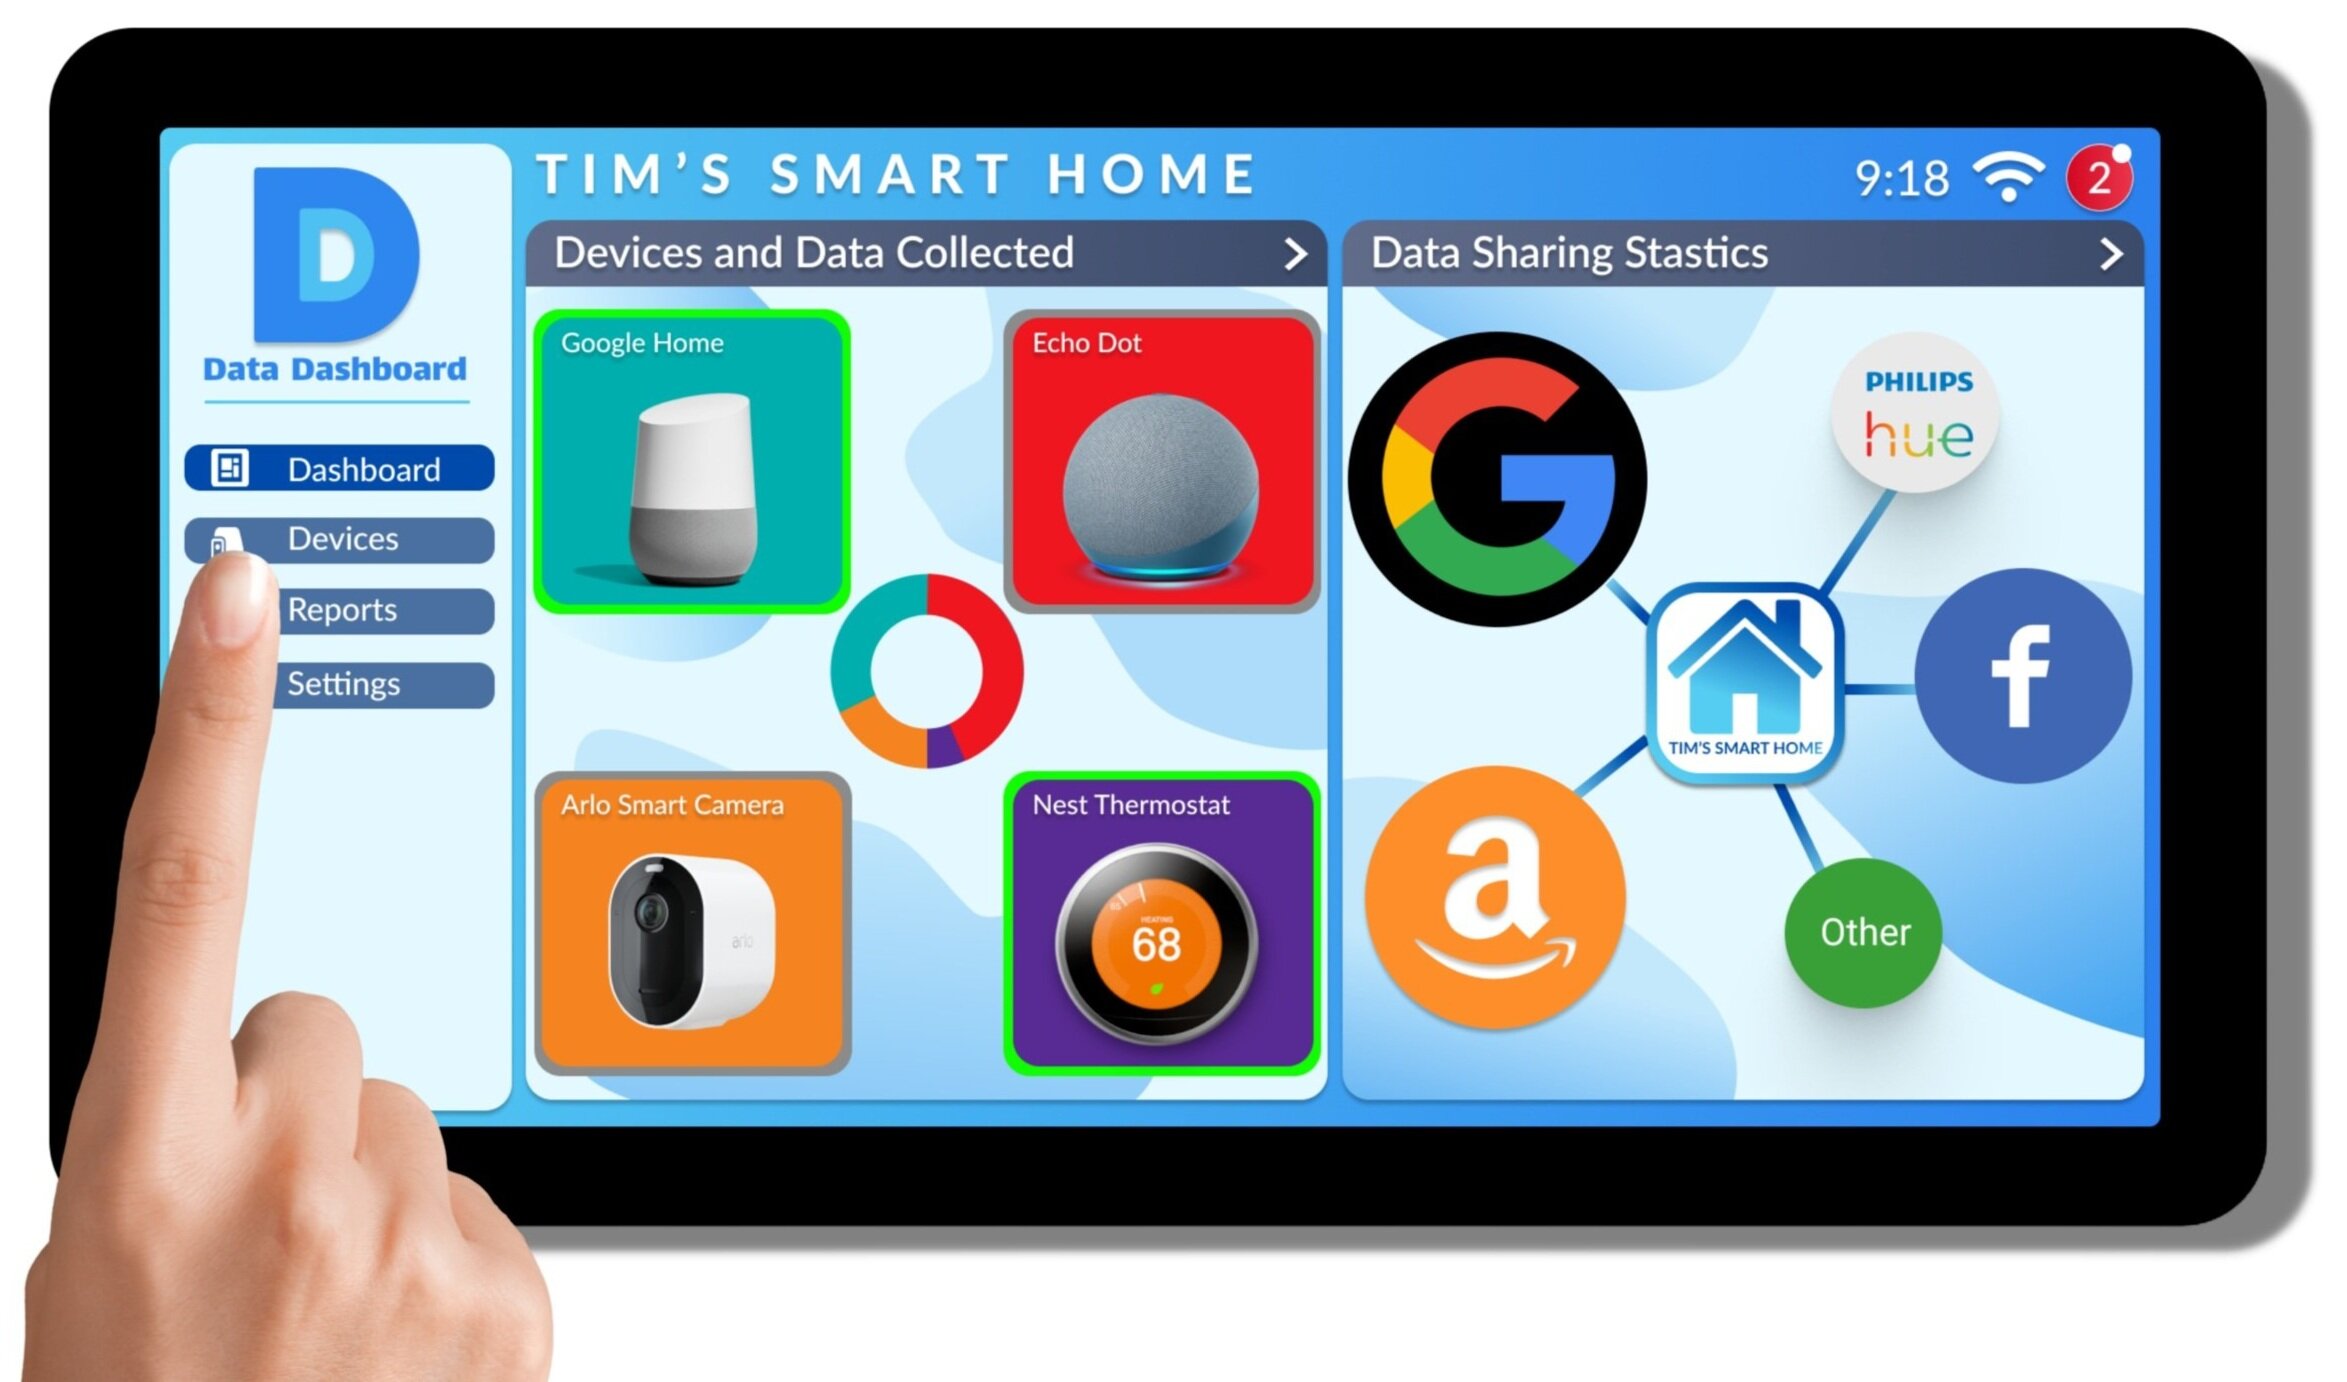
High Fidelity Prototype
Colorful, interactive and ready to test!
Home

Devices

Reports

Settings

Notifications

Cognitive Walkthroughs
Evaluating the learnability of the Privacy Data Dashboard
The decision to implement cognitive walkthroughs was contemplated by considering the limited access of the product to users and resources for usability testing. Cognitive walkthroughs are known to pertain to evaluation of interactive systems for learnability and usability purposes. The aim was to inspect the usability of the Privacy Data Dashboard on each step through the interaction. This cognitive walkthrough focused on both the users and the bystander perspectives of interaction.
For both users and bystanders, being able to gain insights and cater their privacy preferences in a smart home was identified as a top task for implementing the cognitive walkthrough. This cognitive walkthrough was implemented through zoom in a virtual setting. A fully functional prototype version of the Privacy Data Dashboard from Figma was used for evaluation.
A group of five individuals including me, grouped together to participate in the cognitive walkthrough which was conducted in a workshop setting. I played the role of facilitator and the recorder for this study while other participants served as evaluators. The evaluators contributed by offering their interpretations of how users and bystanders would perceive the interface and behave in the given situation.
Including me, four out of the five participants were regular users of smart home devices, while one participant was a bystander and did not own smart home devices. Three out of the five participants were involved in the research phase of the Privacy Data Dashboard and were termed product experts. While two participants were UX practitioners from the industry who were introduced to the product for the very first time.
The task and its predefined sequence to perform its successful completion was briefed to all participants at the start of the workshop. To determine whether the user is likely to succeed, an evaluation template was created with reference to the cognitive walkthrough guidelines by Nielsen Norman Group.
The personas and scenarios described in the storyboard were used as a starting point for evaluation of the Privacy Data Dashboard. The following tables showcase the overview of the cognitive walkthrough.
